

Connecting Truckload Business Cycles, Capacity and Rates


Ancient strategy games like Go are often described as taking “minutes to learn, but a lifetime to master” — meaning the rules are simple to understand, but a winning strategy can be elusive. This maxim also applies to the truckload market.
It’s intuitively understood that when available truck capacity exceeds demand for trucking services, rates will drop, and the opposite occurs when demand exceeds capacity. The challenge is knowing when the market will shift from one state to the other.
Truckload demand has been cyclical since deregulation in the late 1980s. Periods with high rates and demand exceeding available truck capacity are followed by loose or soft periods with lower rates and excess trucking capacity. These business cycles are not seasonal but historically last about three years from start to finish.
While the market has been cycling since deregulation, people only really started paying attention after the 2008 economic crisis.
Spot Rates and Carrier Capacity
Chris Pickett, then chief strategy officer at Chicago-based Coyote Logistics, created a chart showing the year-over-year (YoY) change in contract and spot rates over time. The market shifts when the YoY spot rate crosses the YoY contract rate — a cycle is complete when these lines cross twice.
The same behavior is reflected in the DAT Freight & Analytics iQ Benchmark platform, which contains over US$150 billion in annual transportation spend.
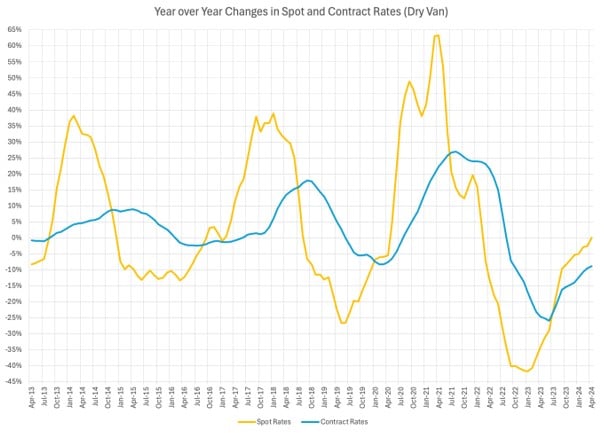
The above graphic shows the last three cycles for the long-haul dry van full truckload market. It illuminates a few key insights.
First, the market is always in a cycle, either expanding or contracting. Second, the first two cycles shown — from the third quarter of 2013 to Q1 of 2017, and Q1 of 2017 to Q1 of 2020 — are similar in duration (36-40 months) and peak spot change (about 38 percent). Third, the current coronavirus pandemic-affected cycle is longer (at least 48 months) and has a higher amplitude than the previous two.
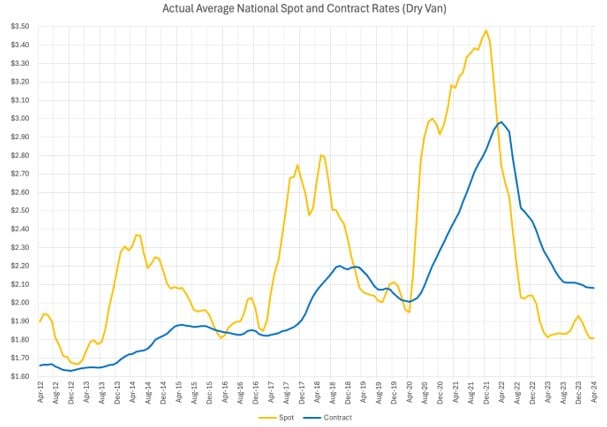
Finally, look at the average spot and contract line-haul rates for the same period in the below graphic. Even though the YoY lines crossed in late 2023, spot rates remain below contract rates.
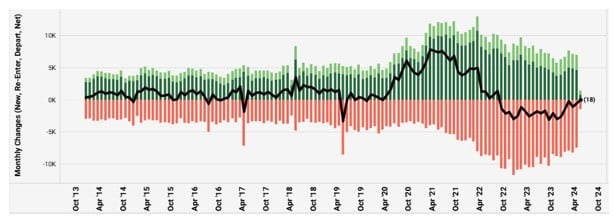
So, what’s happening? We can get a partial answer by examining how carrier capacity changed over the three cycles, which leads to a look at the monthly change in the number of carrier authorizations. While not a perfect metric of carrier capacity, it is a good proxy.
In the graphic below, net change each month (the heavy black line) is relatively stable from 2013 to April 2020 — except for two very sharp downward spikes in May 2017 and June 2019, indicating larger-than-normal exits and the troughs of those cycles. Essentially, the number of carrier authorizations grew at a compounded annual growth rate (CAGR) of just under 6 percent for the six years preceding the start of the pandemic cycle.
The Impact of Smaller Carriers
Compare this to what happened during the pandemic. From early 2020 to early 2022, the number of carrier authorizations grew at a CAGR of 20 percent. Then, over the following two years, it contracted by slightly more than 5 percent CAGR.
Most recently, while the U.S. economy added over 270,000 new jobs in May, the trucking industry lost more than 5,400. While carriers have been exiting the market for more than two years, attrition is nowhere near the rate at which they entered during the pandemic.
Interestingly, most new entrants during the pandemic were owner-operators with a single power unit. There was a lot of money to be made during the pandemic, when average spot rates almost doubled. Unfortunately, many of these new entrants also bought equipment at peak prices and did not count on the corresponding downside of the truckload business cycle. They were the first wave of carriers to exit the market post-pandemic.
Why does this matter? Smaller carriers — and especially owner-operators — tend to work in the spot market. In the full truckload market, 80 percent to 90 percent of loads are under contract, with the rest moving on the spot market. The entry and exit of small carriers have an outsized impact on that sector.
A Route to Market Normalization?
The truckload industry experienced exponential capacity growth to handle the unprecedented surge in demand during the pandemic, but this turned into excess when the stimulus-driven demand subsided. We are seeing signs that the market is normalizing.
After four years of being crushed by forces in the larger business cycle, seasonality in truckload transportation has reappeared. In May, the Commercial Vehicle Safety Alliance’s Roadcheck week (an inspection and regulatory compliance enforcement initiative) and an increase in produce harvests triggered historically expected bumps in spot rates.
So, when will this current pandemic cycle end? Has it already?
This cycle is unique. It will take longer to lower capacity to the point where the average spot rates exceed contract rates. Barring a spike in demand or a sudden contraction of capacity — perhaps caused by changes in regulations — it will take several more quarters.
But the market appears to be inching toward the finish line.
(Photo credit: Getty Images/Shaunl)